Seeking Shade: A journey through Zurich's Urban Biodiversity
Cities are often thought of as concrete deserts, but they are also home to a surprising number of species. Trees, shrubs, insects, birds, and even small mammals all try to make a living in the urban fabric. At the same time, cities are hotspots of the so-called urban heat island effect: built surfaces absorb and store heat during the day and release it slowly at night, keeping temperatures higher than in surrounding rural areas. As summers become hotter, this creates growing challenges for both urban biodiversity and for how people experience heat in everyday city life.
Why green corridors matter
As cities continue to grow worldwide1, urban green spaces are becoming more than just places to relax or walk the dog. They are increasingly seen as ecological infrastructure: networks of parks, street trees, riversides, and vegetated strips that allow species to move, survive, and adapt in a changing climate2.
Previous research has shown that connected green areas, often called eco-corridors or green corridors, are especially important. They help species move through the city, reduce isolation between populations, and are among the strongest predictors of how many species a city can support3. On top of that, vegetation cools the city through shade, evapotranspiration, and by allowing air to circulate. Some studies suggest that well-designed green corridors can lower local air and surface temperatures by several degrees.
Inspired by this, our project focused on Zurich and asked a very practical question: do eco-corridors really make a difference on the ground? And if they do, is that difference visible both in temperature and in biodiversity?
Our urban experiment: six squares, two stories
To explore this, we looked at six well-known community squares in Zurich. Three of them are intersected by designated eco-corridors:
- Bucheggplatz
- Hegibachplatz
- Schwammendingerplatz
We compared these with three squares of similar size and urban character, but without eco-corridors:
- Hottingerplatz
- Sechseläutenplatz
- Waffenplatz
Before diving into the data, let’s take a closer look at these six squares. Click on the map below to explore their locations, see photos, and get a feel for the green corridors and urban layout.
Such community squares are part of everyday life as busy intersections, meeting points, event locations, or transit hubs. That makes them ideal for asking how urban design affects both people and nature. We compared the six squares using three indicators:
- Physiologically Equivalent Temperature (PET): a measure of how hot it feels, not just how hot it is. PET combines air temperature, humidity, wind, and solar radiation4.
- Species richness: the number of different species observed.
- Shannon diversity index: a measure that accounts for both the number of species and how evenly they are represented.
To do this, we combined temperature data from the Canton of Zurich’s heat stress maps5 with biodiversity observations from iNaturalist6, a global, open-source platform where people record plants and animals they encounter. The result was a map that brings together microclimate, biodiversity, and eco-corridor patterns, and allows us to see how they overlap (Figure 1).
What we found when the city heats up
First, the bad news: the urban heat island effect was visible at all six squares. Temperature differences within a single square often reached 5 to 8 degrees Celsius. That means stepping from a shaded, green patch onto open asphalt can feel like entering a different climate zone. That said, there were clear patterns.
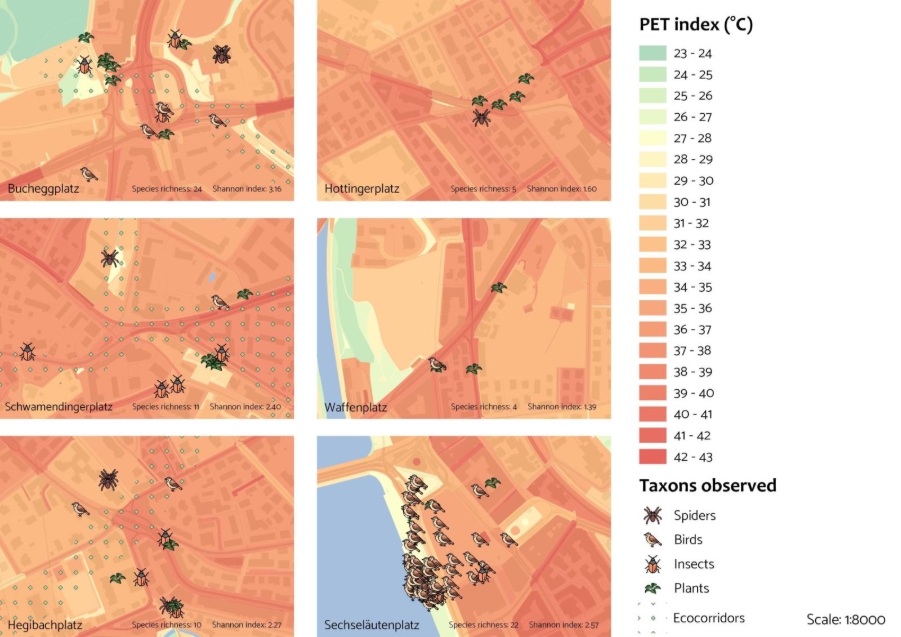
Figure 1: Physiologically Equivalent Temperature (PET) and biodiversity across six squares in Zurich.
Cooler corridors (with some exceptions)
In general, areas along eco-corridors were slightly cooler than their surroundings. Trees, grass, and connected green structures helped buffer the heat. However, the picture was not uniform. At Schwamendingerplatz, for example, roads and green tram lines still showed high temperatures, reminding us that not all “green-looking” infrastructure cools equally well. Interestingly, squares without eco-corridors also showed cooling effects where vegetation was present. At Hottingerplatz, even a small pocket park reduced road temperatures by up to 7 degrees. This highlights that eco-corridors matter, but so does any greenery, even small patches can make a difference.
More life where green connects
When it came to biodiversity, squares with eco-corridors generally hosted more species and higher diversity than those without. Trees, shrubs, and connected habitats provide food, shelter, and routes for urban wildlife.
There was one notable exception: Sechseläutenplatz. Despite lacking an eco-corridor, it showed high biodiversity. The reason becomes obvious once you consider its location. Right next to Lake Zurich, the square attracts aquatic birds such as swans and ducks – and people love to photograph and report them. This highlights how water bodies can strongly shape urban biodiversity patterns.
A short detour: how do we actually measure biodiversity?
Biodiversity can be described in different ways, depending on what aspect of nature we want to capture.
Species richness is the simplest measure: it counts how many different species are present in a place. Shannon diversity goes one step further by also considering how evenly individuals are distributed among those species7.
For example, two sites may host the same number of species, but the one where no single species dominates will be considered more diverse. In our study, we used both metrics to capture complementary aspects of urban biodiversity.
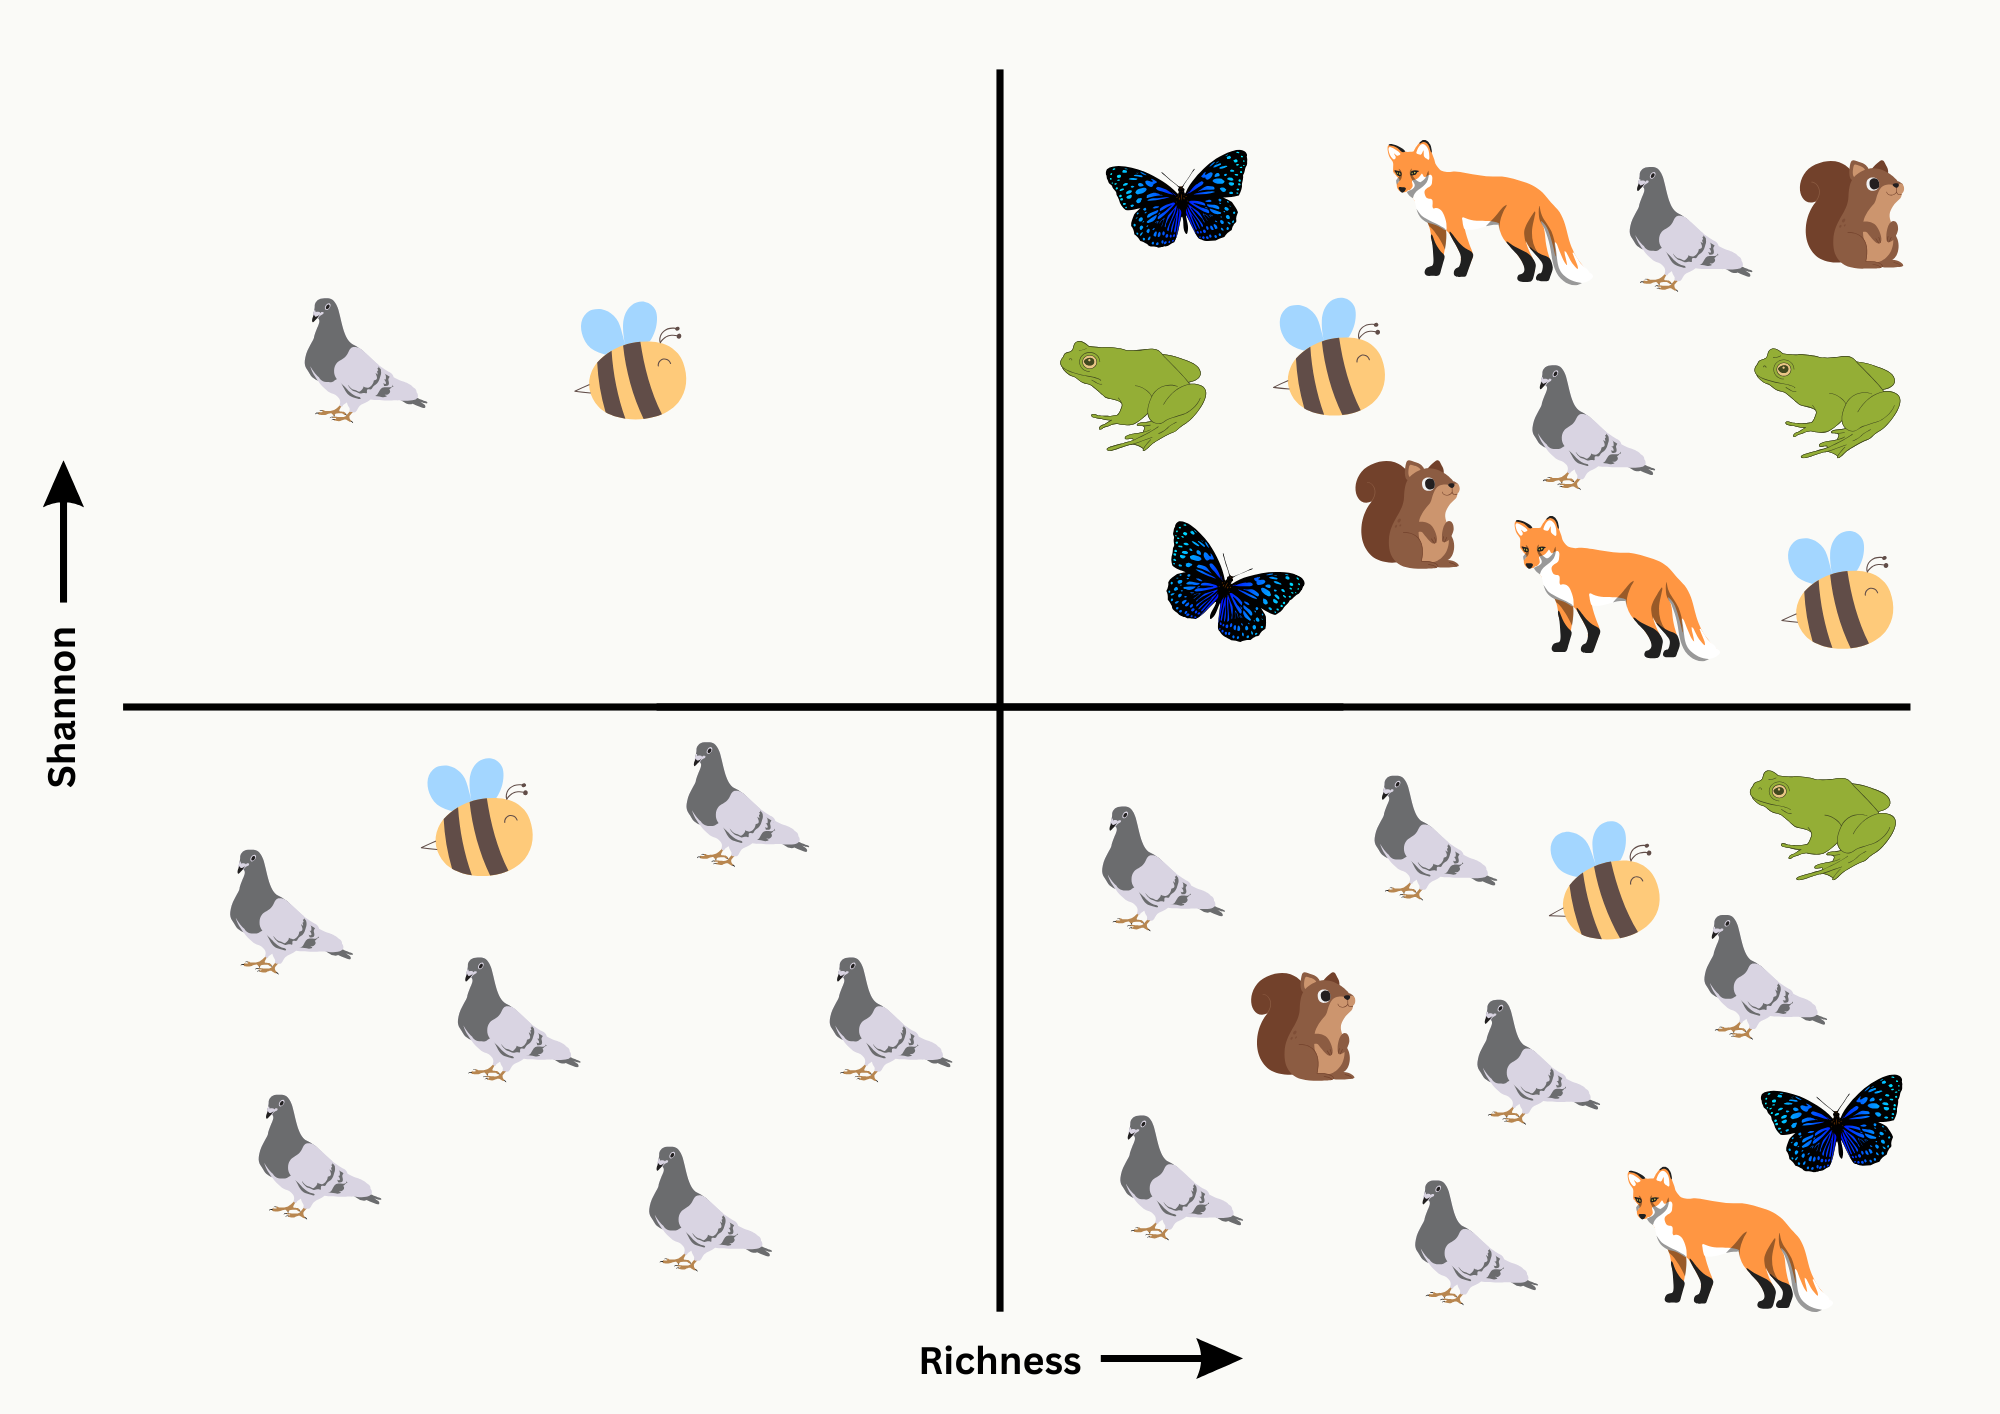
Figure 2: Species richness increases as more species are added to a community, regardless of their relative abundances (left to right). The Shannon diversity index increases both when more species are present and when their abundances become more even (bottom to top).
Citizen science: your observations matter
All biodiversity data in this project came from iNaturalist, and that is one of its strengths as well as its challenges. Anyone can contribute to iNaturalist. You do not need to be a biodiversity expert. Simply take a photo of a plant, insect, bird, or fungus, upload it, and the community will help identify it. Experts, enthusiasts, and algorithms work together to improve data quality. This also means that some places get more observations than others: popular waterfronts attract more attention than quiet street corners. Still, platforms like iNaturalist are incredibly valuable for understanding urban biodiversity at large scales. If you enjoy spending time outdoors, consider contributing yourself at https://www.inaturalist.org/. Your next walk through Zurich could help science.What does this mean for Zurich?
Our small study cannot provide final answers, as six squares are not enough to draw sweeping conclusions. But the patterns we observed are telling.
Eco-corridors tend to be cooler and more biodiverse than similar spaces without them. At the same time, vegetation in general, water bodies, surface materials, and urban design all interact in complex ways. Asphalt heats up quickly, trees provide shade, water attracts species, and observation data reflects where people like to spend time.
In other words: eco-corridors are important, but they are not a magic solution on their own.
Living with heat
After experiencing just how hot Zurich can get during the day, one thing becomes clear: heat is a serious challenge for both humans and biodiversity. Eco-corridors can provide refuge, but many questions remain open. How safe is it for animals to cross busy intersections? How dangerous is hot asphalt for small creatures on scorching days?
City authorities can play a key role in addressing these issues. For urban planners, this means:
- Planting more heat-tolerant trees
- Greening facades and roofs
- Designing ventilation corridors for air flow
- Replacing dark asphalt with lighter, reflective materials
- Connecting green spaces into functional networks
- Providing shade and access to cool indoor spaces
For urban dwellers, heat awareness is just as important. During heatwaves:
- Stay hydrated
- Limit outdoor activity to mornings and evenings
- Ventilate homes at night
- Check in on people vulnerable to heat
- Seek shade when outdoors
A particularly helpful tool in Zurich is the Shadowmap, which shows where buildings cast shade in real time depending on the sun’s position: https://app.shadowmap.org/.
Towards a cooler, more diverse city
Heat will remain a defining challenge of urban life in the coming decades. But cities are also places of innovation, creativity, and opportunity. By combining thoughtful urban planning, connected green spaces, and active citizen participation, Zurich can become more resilient, not only for people, but for the many species that share the city with us. Because when it’s “36 Grad und es wird noch heisser”, a bit more shade, green, and life can make all the difference.
References
- Chen, G., Li, X., Liu, X., Chen, Y., Liang, X., Leng, J., ... & Huang, K. (2020). Global projections of future urban land expansion under shared socioeconomic pathways. Nature Communications, 11(1), 537.
- Velasco, J. A., Luna-Aranguré, C., Calderón-Bustamante, O., Mendoza-Ponce, A., Estrada, F., & González-Salazar, C. (2024). Drivers of urban biodiversity in Mexico and joint risks from future urban expansion, climate change, and urban heat island effect. PLOS ONE, 19(10), e0308522.
- Beninde, J., Veith, M., & Hochkirch, A. (2015). Biodiversity in cities needs space: a meta-analysis of factors determining intra-urban biodiversity variation. Ecology Letters, 18(6), 581–592.
- Kappes, H., Katzschner, L., & Nowak, C. (2012). Urban summer heat load: Meteorological data as a proxy for metropolitan biodiversity. Meteorologische Zeitschrift, 21(5), 525.
- Amt für Städtebau Zürich. Kommunaler Richtplan Siedlung, Landschaft, öffentliche Bauten und Anlagen (SLöBA). https://www.stadt-zuerich.ch/content/dam/web/de/planen-bauen/stadtplanung/dokumente/kommunaler-richtplan/sloeba/krp-sloeba-richtplankarte.pdf [accessed 30 November 2025].
- iNaturalist. https://www.inaturalist.org [accessed 30 November 2025].
- Magurran, A. E. (2003). Measuring biological diversity. John Wiley & Sons.
All images have been taken by the authors.
Comments
Post a Comment